Complex Wavelets Advantage Over Real - Simply Explained
A simple guide to use real and complex wavelets for data analysis without the need of understanding the math behind.


What Wavelets Are Used For
Extract time dependent frequency information from data. Wavelets are also used for image and audio compression, but this is out of scope here.
How It Works
Wavelet Transform means runnig a little test function,the wavelet, all across the sample-data and multiplying and summing up the result for each position of the sample-data to a new value. This has the effect that when a subset of the sample-data is 'similar' to the wavelet the resulting value is high while and when it is not alike it is low. Giving a filtered sample-data that has high values where the wavelet has good matching, and low values where it hasn't. The wavelet is then stretched (scaled) and the same thing is done again for different scales. The result is a 3D-Map that has scale in one direction and time in the other. The third is the amplitude, that is how much at this time this scale of this wavelet is represented in your data. These scale values are proportional to 1/frequency.
Wavelet Analysis With Python
Use pip install pywavelets and check out the example code below
Transform Using Real Values Wavelet
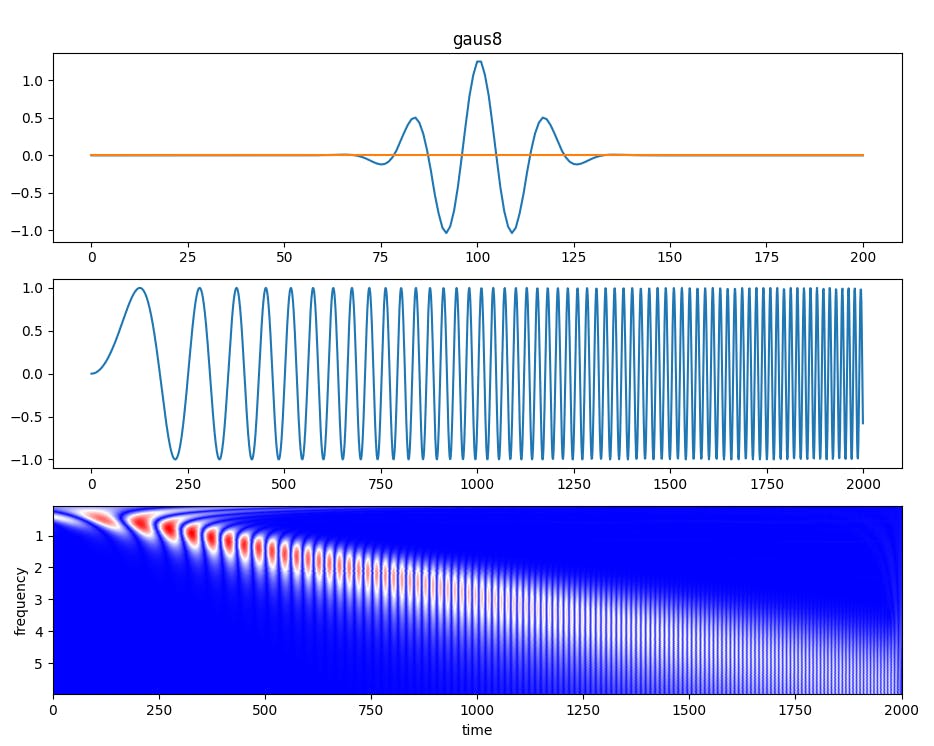
The Top picture shows the wavelet used, the second the sample-data, that is a chirp in this case.
The third subplot shows the result of the wavelet transform. The analysis highlights the area of the matching frequency, but there are areas of 0 intensity (blue) between the dot-shaped high intensity regions (red). The reason is that using a wavelet defined by real values will result in a mixture of intensity and phase matching regards the sample-data. In other words, even if the frequency matches best, the result is 0 when the phase is shifted by 1/4th. Therefore we see blue areas in between the red dots.
The solution to overcome this is to use complex wavelets instead. This allows to split the frequency matching from the phase matching. This is, because the absolute value of the complex coefficients yield how good the frequency is met, while the angle of the complex coefficients yield the phase shift.
Transform Using Complex Values Wavelet
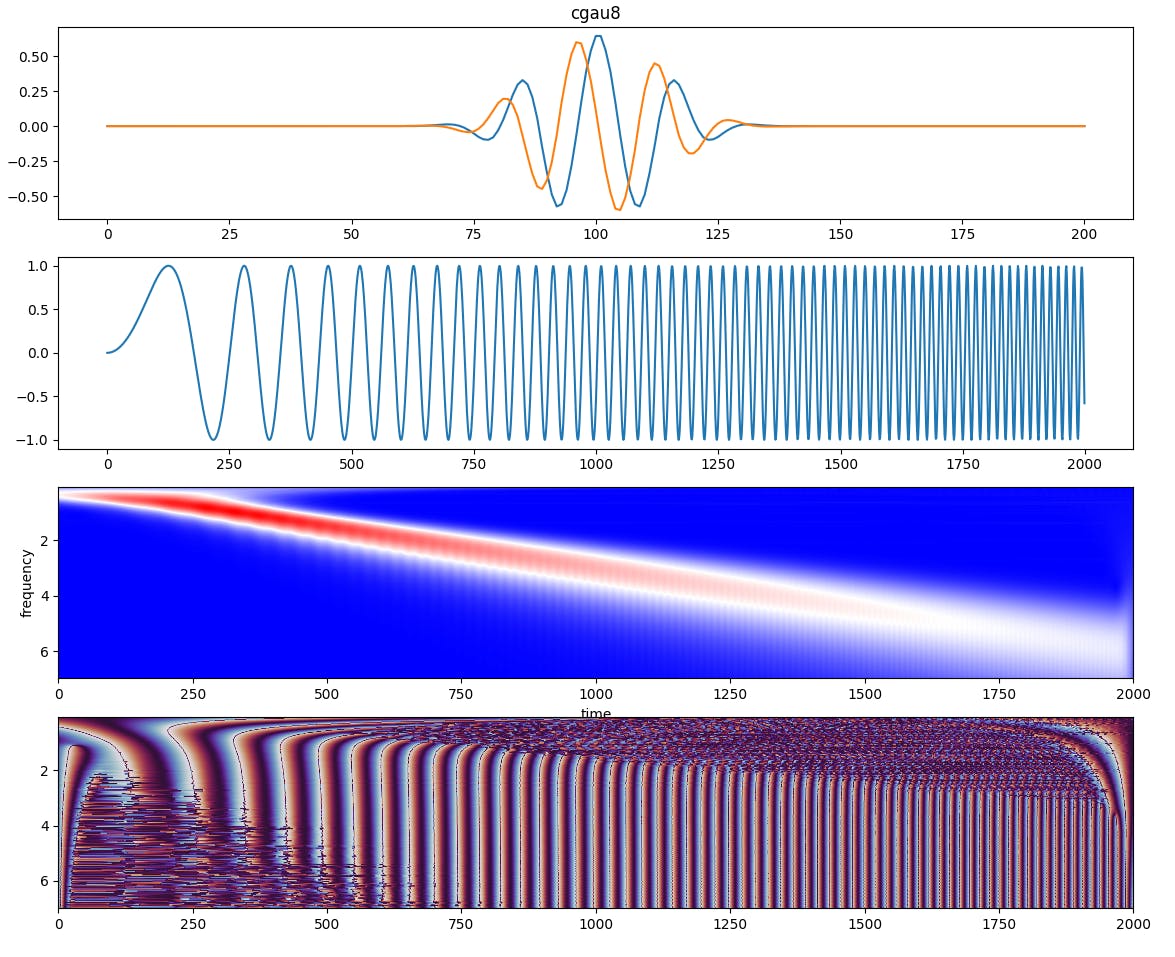
The third plot again shows the absolute values. Since the complex wavelet was used the gaps are gone. What happened to the phase shift? This information is in the angle of the complex value and shown in the fourth plot now.
Code
import pywt
import numpy as np
from matplotlib import pyplot as plt

#choose one of the supported mother-wavelets
# ['cgau1'...'cgau8', 'cmor', 'fbsp', 'gaus1'...'gaus8', 'mexh', 'morl', 'shan']
#mother_wavelet = 'cmor1.0-3.0'
#mother_wavelet = 'gaus8'
mother_wavelet = 'cgau8'

chirp = []
samplerate = 100 #in Hz
sampletime = 20 # in seconds

#create some sample data. A chirp is a good one to demonstrate wavelet analysis
x = np.linspace(0, sampletime ,samplerate * sampletime)
chirp = np.sin(x**2)

# Witdths defines the scales at which the transform is performed.
# width = C / frequency, with C being dependent on the wavelet chosen,
# therefore this might have to be adjusted when using another wavelet type.
# Choosing the steps with 1/x make them equidistant in frequencies
widths = 1/np.arange(0.00025,0.1,step=0.00025)


fig, (s1,s2, s3,s4) = plt.subplots(4)
#a spike-like funktion to get a simple plot of what the wavelet looks like
spike = np.zeros(201)
spike[95:106] = np.ones(11)
cwtmatr_spike, _ = pywt.cwt(spike, 10, mother_wavelet)

#the actual wavelet transform, for convenience the pywt.cwt() returns a list of frequencies for each of the widths
cwtmatr_chirp, freqs_chirp = pywt.cwt(chirp, widths, mother_wavelet, sampling_period=1. / samplerate)

#show what the wavelet looks like
s1.plot(np.squeeze(np.real(cwtmatr_spike)))
s1.title.set_text(mother_wavelet)
s1.plot(np.squeeze(np.imag(cwtmatr_spike)))
s1.set_title(mother_wavelet)

#show what the data looks like
s2.plot(chirp)
cwtmatr_chirp_abs = np.abs(cwtmatr_chirp)
cwtmatr_chirp_angle = np.angle(cwtmatr_chirp)

#show the analysis results
#Plot in a picture with x-Axis beeing the time, y-Axis the frequency and the absolute value mapped to colors blue = 0, white = mean, red = max
#since equidistant frequencies are used simple rescale of y-axis can be done
s3.imshow(cwtmatr_chirp_abs, extent=[0, sampletime * samplerate, freqs_chirp[-1], freqs_chirp[0]], cmap='bwr', aspect='auto', vmax=cwtmatr_chirp_abs.max(), vmin=0)
s3.set_ylabel('frequency')
s3.set_xlabel('time')

#if a complex wavelet is used the angle shows the phase relation to the sample data
if cwtmatr_chirp.dtype == np.complex128:
    s4.imshow(cwtmatr_chirp_angle, extent=[0, sampletime * samplerate, freqs_chirp[-1], freqs_chirp[0]], cmap='twilight', aspect='auto', vmax=np.pi, vmin=-np.pi)

plt.show()

'''
Copyright 2021 Marco Noll, Garmin International Inc. Licensed under the Apache
License, Version 2.0 (the "License"); you may not use this file except in compliance
with the License. You may obtain a copy of the License at

http://www.apache.org/licenses/LICENSE-2.0

Unless required by applicable law or agreed to in writing, software distributed
under the License is distributed on an "AS IS" BASIS, WITHOUT WARRANTIES OR
CONDITIONS OF ANY KIND, either express or implied. See the License for the specific
language governing permissions and limitations under the License.
'''
Remarks
I found the YouTube videos of Mike X Cohen very useful, to get a fundamental understanding without getting caught up in the mathematical details. One of these also helped me to understand why and how the Fourier transform is used to actually calculate the wavelet transform.
The correlation of scale and frequency is determined by the type of wavelet chosen. Since the wavelet does not have a single frequency (otherwise it would be infinite sin wave instead of a wavelet), frequency refers to the center frequency of the wavelet.